We find ourselves amidst one of the most bifurcated housing markets on record.
National house prices have witnessed a year-over-year increase, with the Zillow Home Value Index revealing a growth of +2.1%, even surpassing the 2022 peak by +0.5%. However, the narrative takes an intriguing turn when we delve into individual markets. Metro area markets like Austin and New Orleans are grappling with a year-over-year decline of -10% and -8.8%, respectively, while house prices in markets in New Haven and Hartford are up +9.6% and +11.1% on a year-over-year basis.

The conundrum of such a split housing market can be attributed to the impact of the ongoing mortgage rate shock, which has translated into a notable pullback in both supply (i.e. new listings) and demand across the nation. However, the pullback varies by market.
In markets like Austin, the pullback in demand has outpaced the decline in new listings, creating an environment of greater softening. This, in turn, has led to a rise in active listings in Austin and exerted downward pressure on prices. To put it simply, outside investment pushed Austin house prices too far beyond local fundamentals during the pandemic boom, and now prices there are undergoing a correction.
Conversely, in markets like Hartford, where fundamentals like price-to-rent ratios are less distorted, the pullback in supply has outpaced the reduction in demand. This delicate equilibrium between supply and demand dynamics keeps prices on an upward trajectory in Hartford, allowing sellers to maintain the upper hand in negotiations.

The regional house price data in this ResiClub article is sourced from the latest Zillow Home Price Index reading. It is presented without seasonal adjustments and covers data up to September 2023.
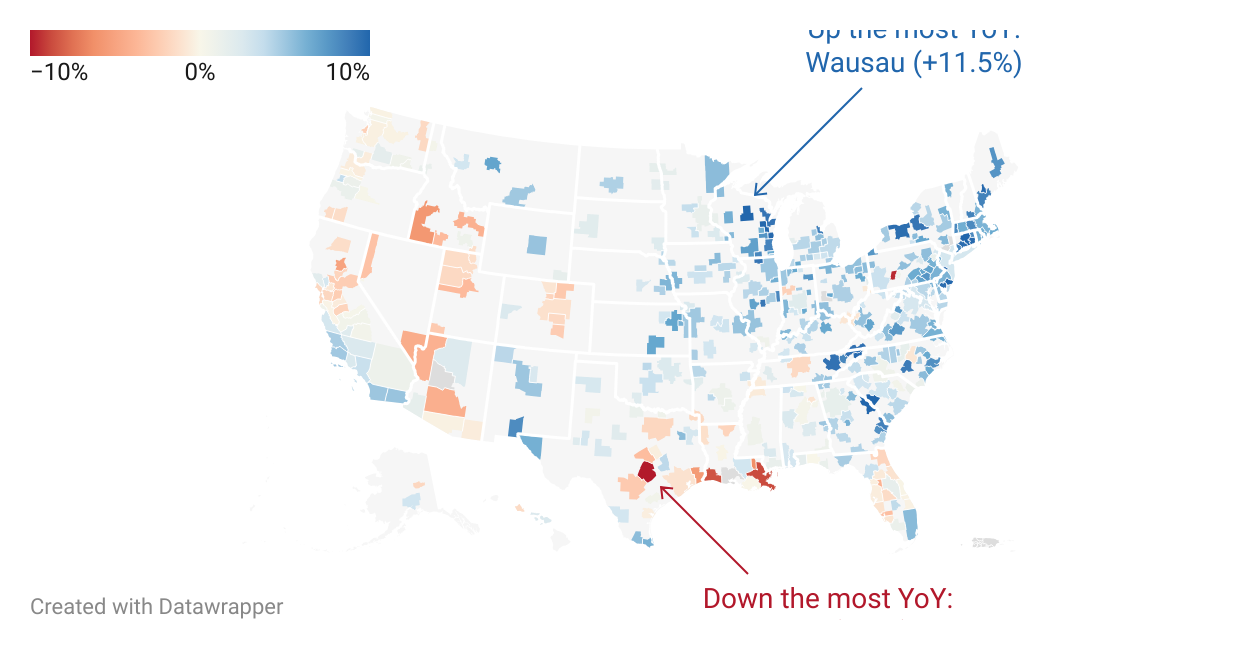
Note: MoM = Month-over-month shift in home prices between Aug. 2023 and Sept. 2023. YTD = Year to date shift in home prices between Dec. 2022 and Sept. 2023. YoY = Year-over-year shift in home prices between Sept. 2022 and Sept. 2023.

If you click the image below, you’ll be taken to a link where you can view an interactive map showing the house price change between Sept. 2022 and Sept. 2023 in America’s 400 largest regional housing markets.