- ResiClub
- Posts
- Buyer’s or seller’s housing market? Zillow's updated regional ratings
Buyer’s or seller’s housing market? Zillow's updated regional ratings
Where home sellers—and home buyers—have the most power right now, according to Zillow’s updated analysis released in October.
Today’s letter is brought to you by Lennar Investor Marketplace!
There’s no better place to start looking for a promising SFR investment than on Lennar Investment Marketplace, an online platform that offers more than 2,000 rental-ready, investment-friendly homes. These properties span a wide range of 90+ locations nationwide, from bustling urban centers to serene suburban neighborhoods, providing a diverse portfolio depending on your strategies and preferences.
Each home is carefully selected and vetted to ensure it meets Lennar's high standards, making them attractive options whether you’re a seasoned investor or new to the real estate market. As a member, you can access a real-time underwriting dashboard, institutional-quality rental comps and area demographics for each listing. Plus, you get end-to-end purchasing support, including pre-negotiated financing, property management, insurance and title services through Lennar's affiliates.¹ From initial evaluation all the way to closing, investing with Lennar is seamless and efficient.
Join today to start browsing properties
Zillow economists use an economic model they call the Zillow Market Heat Index to gauge the competitiveness of housing markets across the country. This model looks at key indicators—including home price changes, inventory levels, and days on market—to generate a score showing whether a market favors sellers or buyers.
Higher scores point to hotter, seller-friendly metro housing markets. Lower scores signal cooler markets where buyers hold more negotiating power.
According to Zillow:
Score of 70 or higher = strong sellers market
Score from 55 to 69 = sellers market
Score from 44 to 55 = neutral market
Score from 28 to 44 = buyers market
Score of 27 or below = strong buyers market
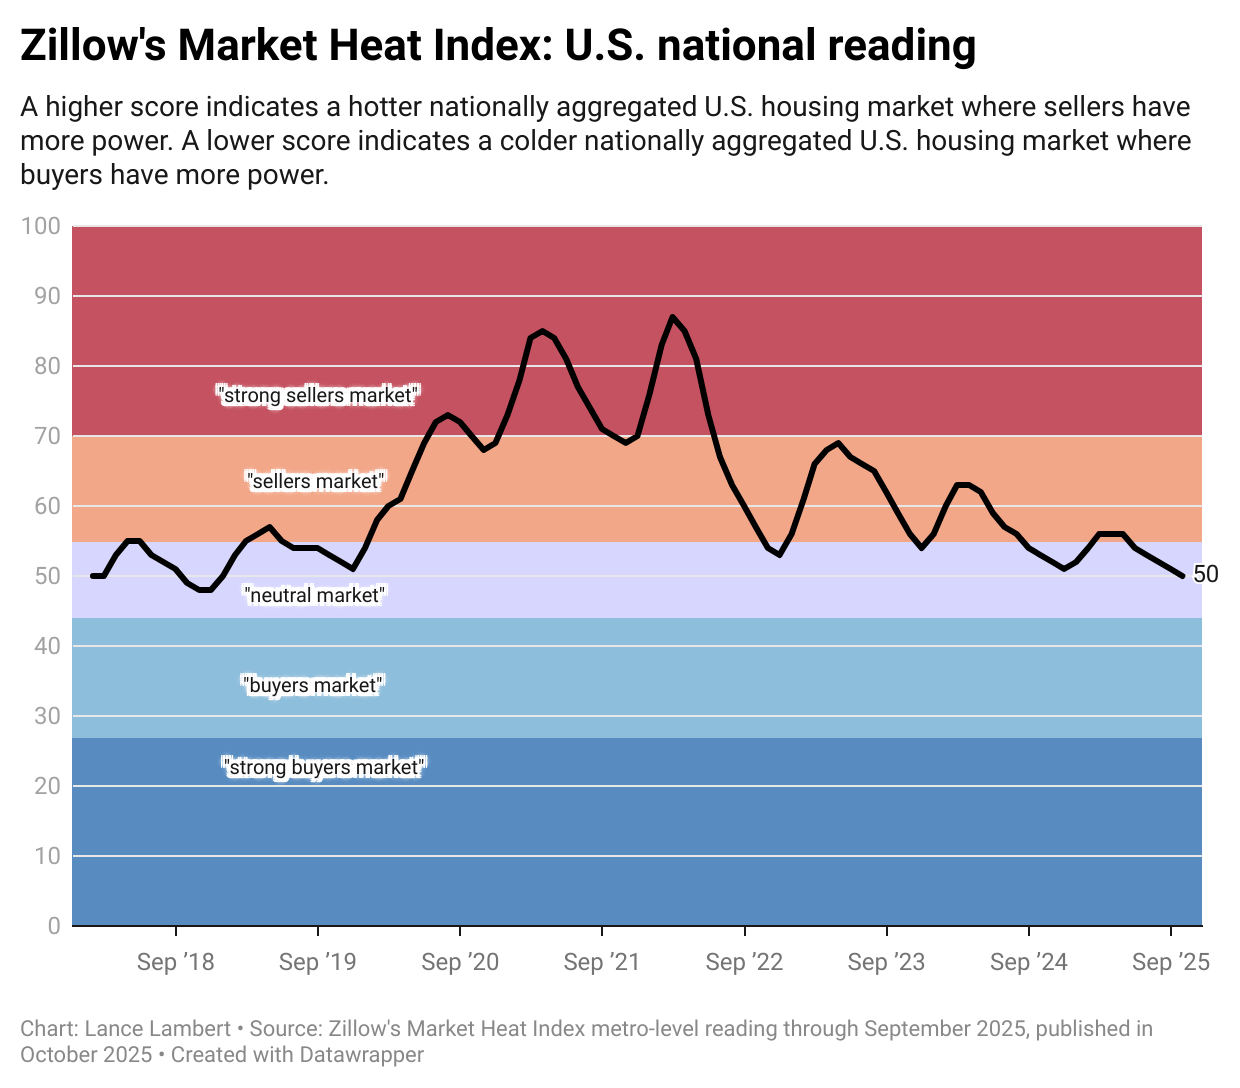
Within the ResiClub Terminal—our data and analytics platform designed for housing sector executives, professionals, and investors—ResiClub PRO members can access this index output along with roughly 70+ other metrics.
For today’s issue, we’ve included a screenshot showing a metro-level view of the Zillow Market Heat Index for every September reading since 2019. [The ability to change dates is one of the features in the ResiClub Terminal that helps housing stakeholders better analyze the housing market, IMO.]
What the index looked like in September 2019 👇
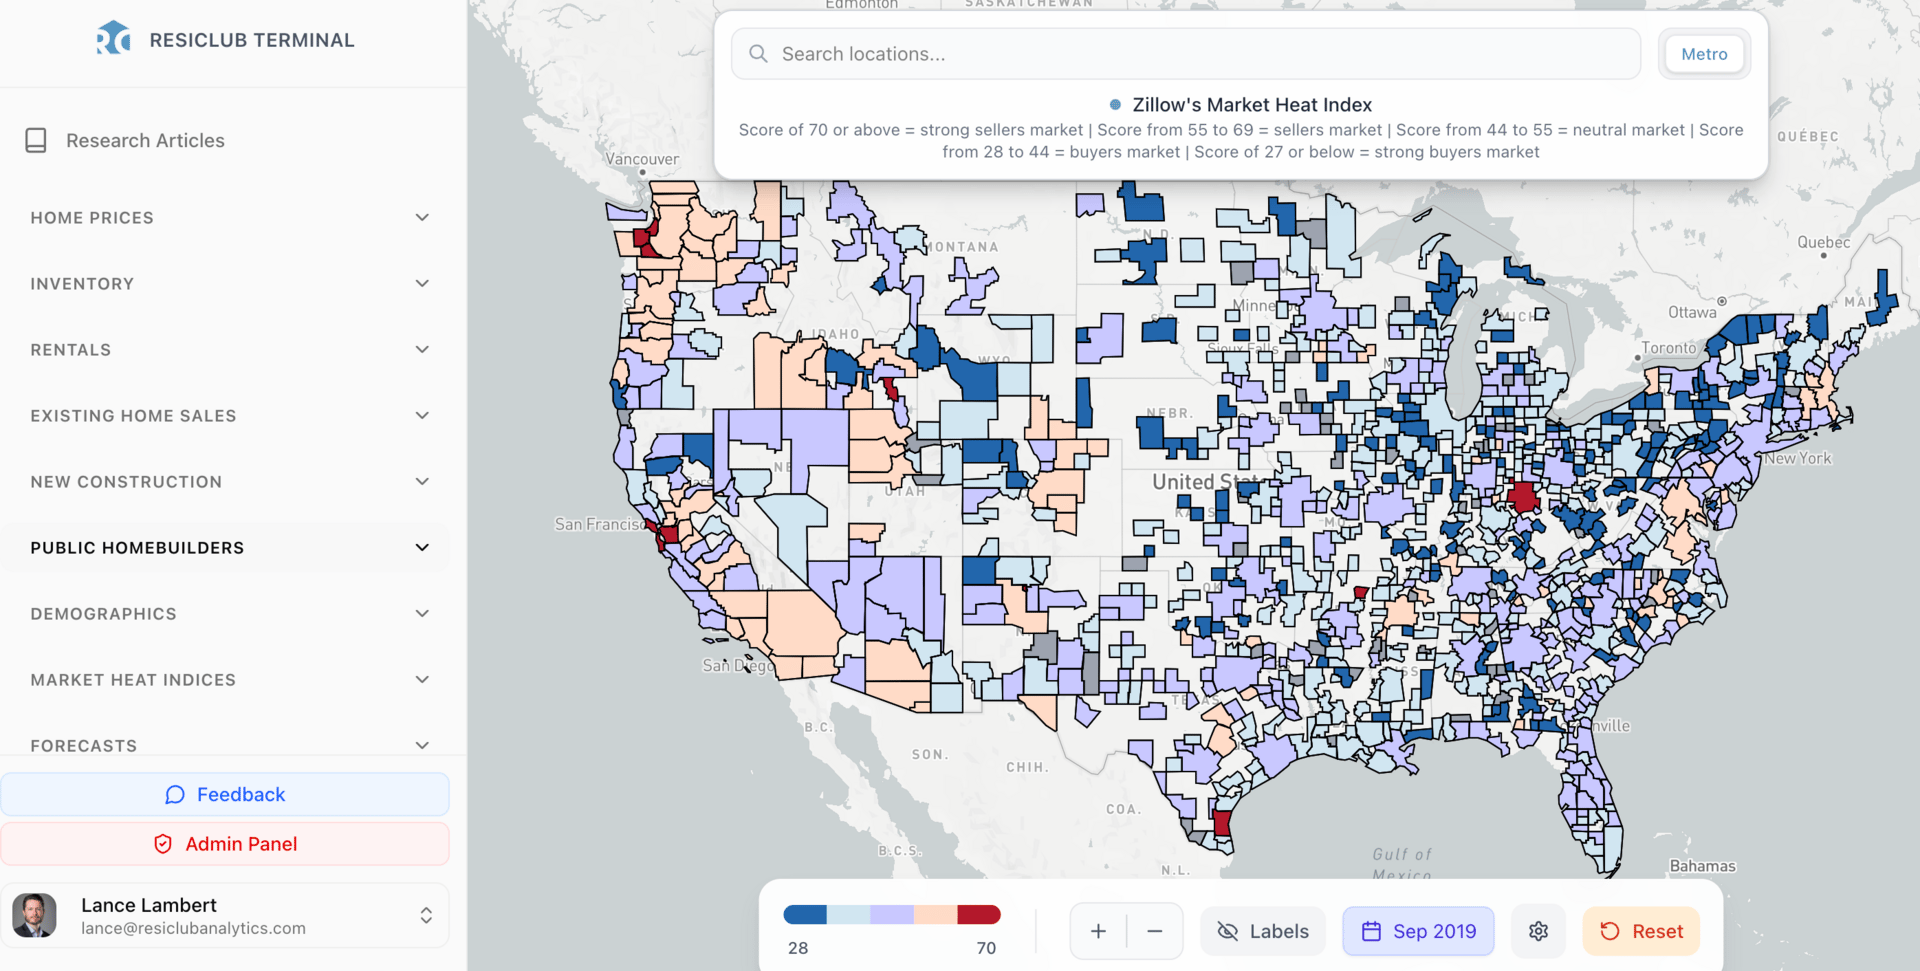
What the index looked like in September 2020 👇
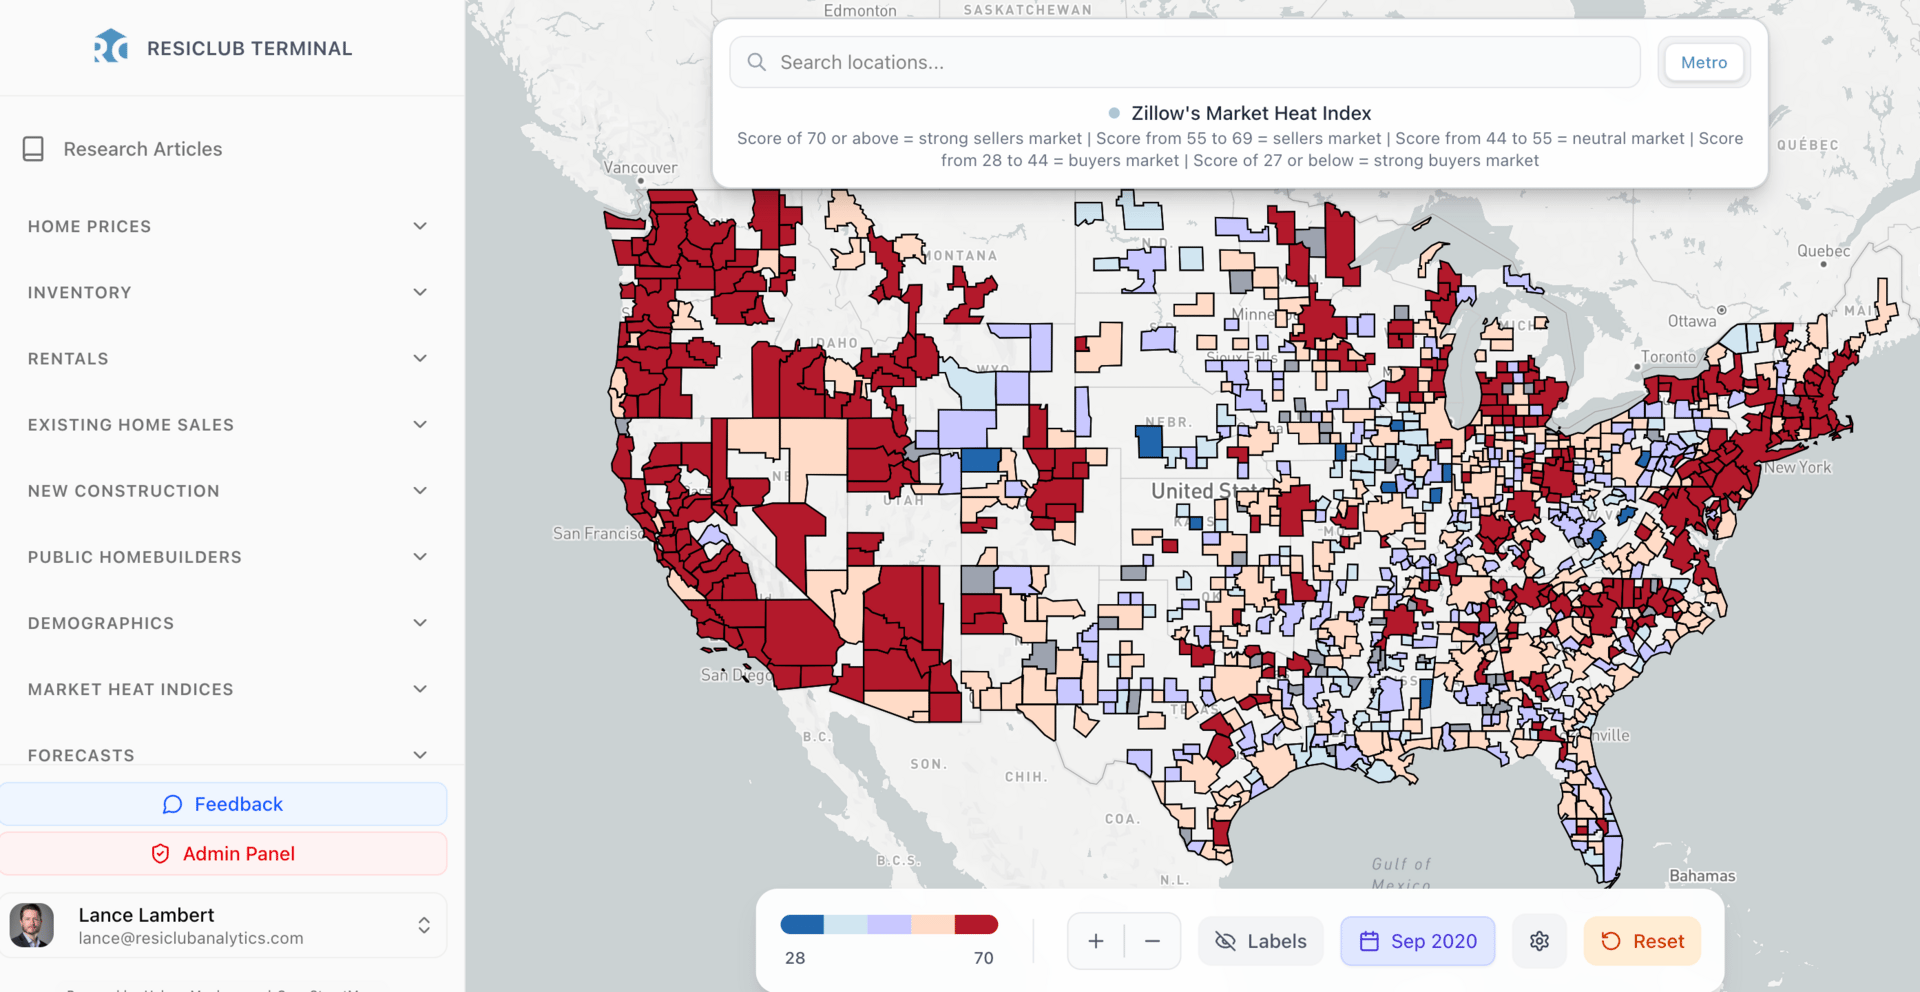
What the index looked like in September 2021 👇
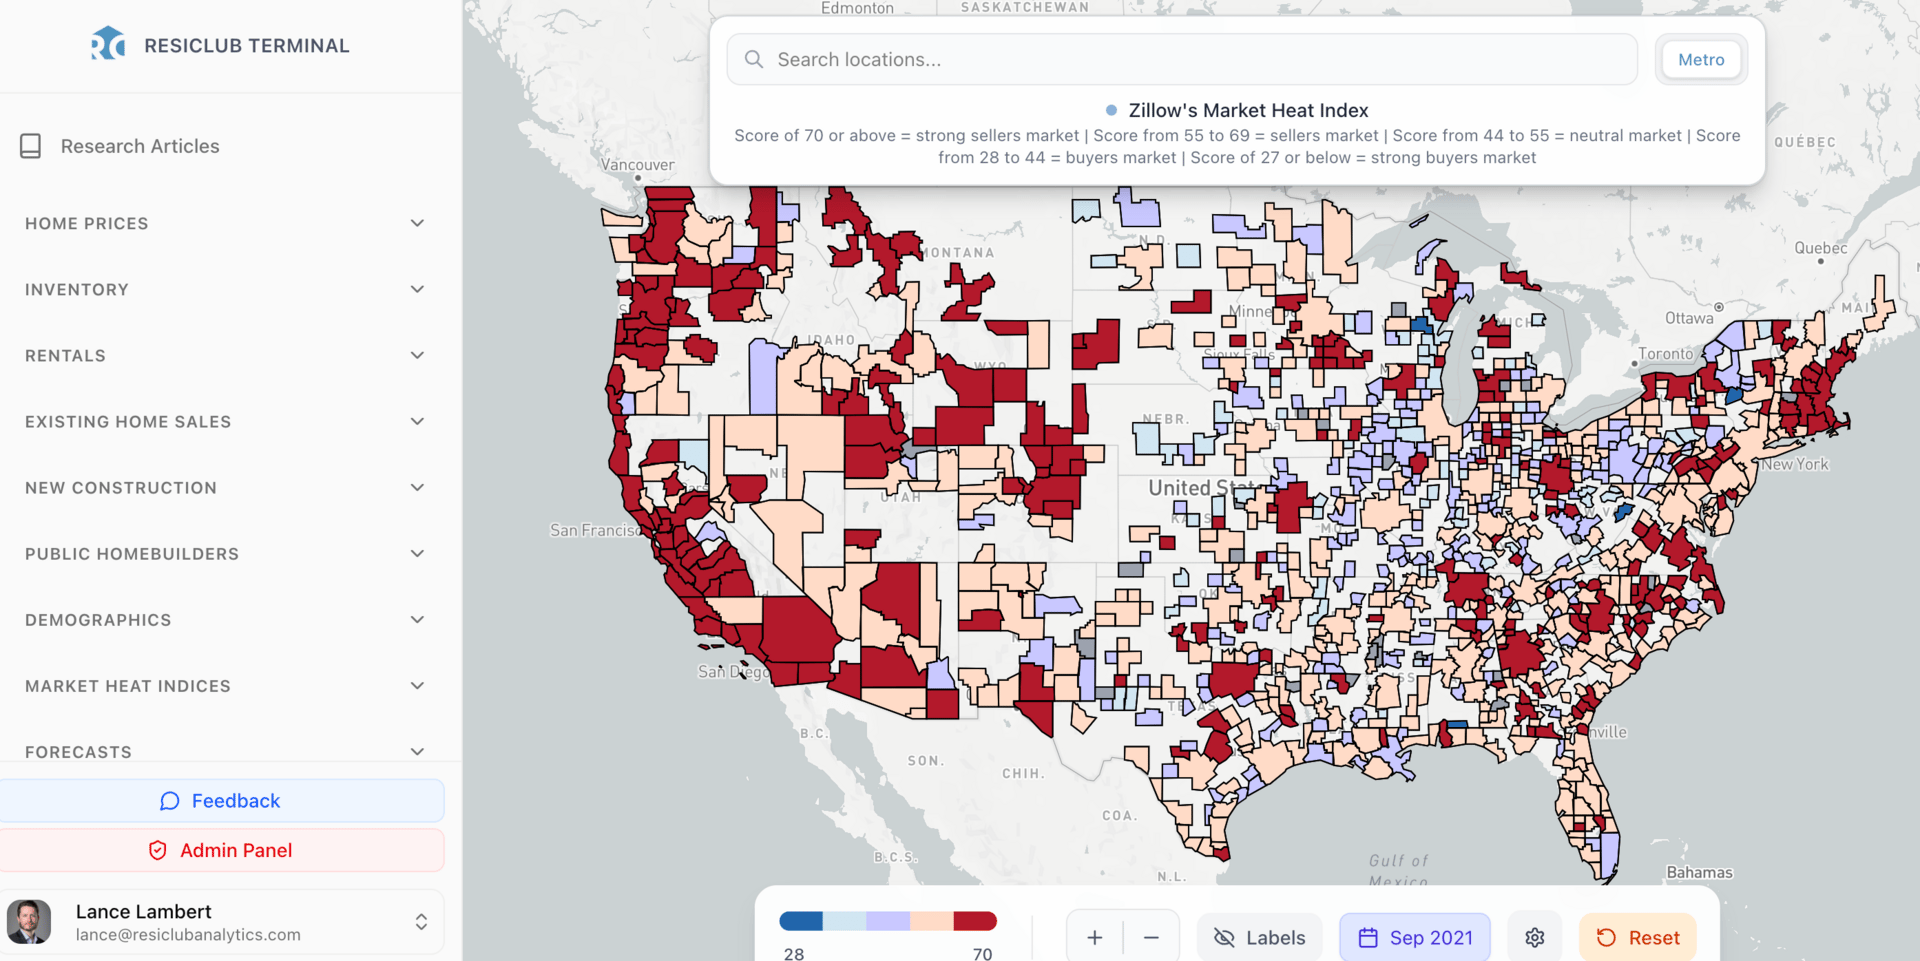
What the index looked like in September 2022👇
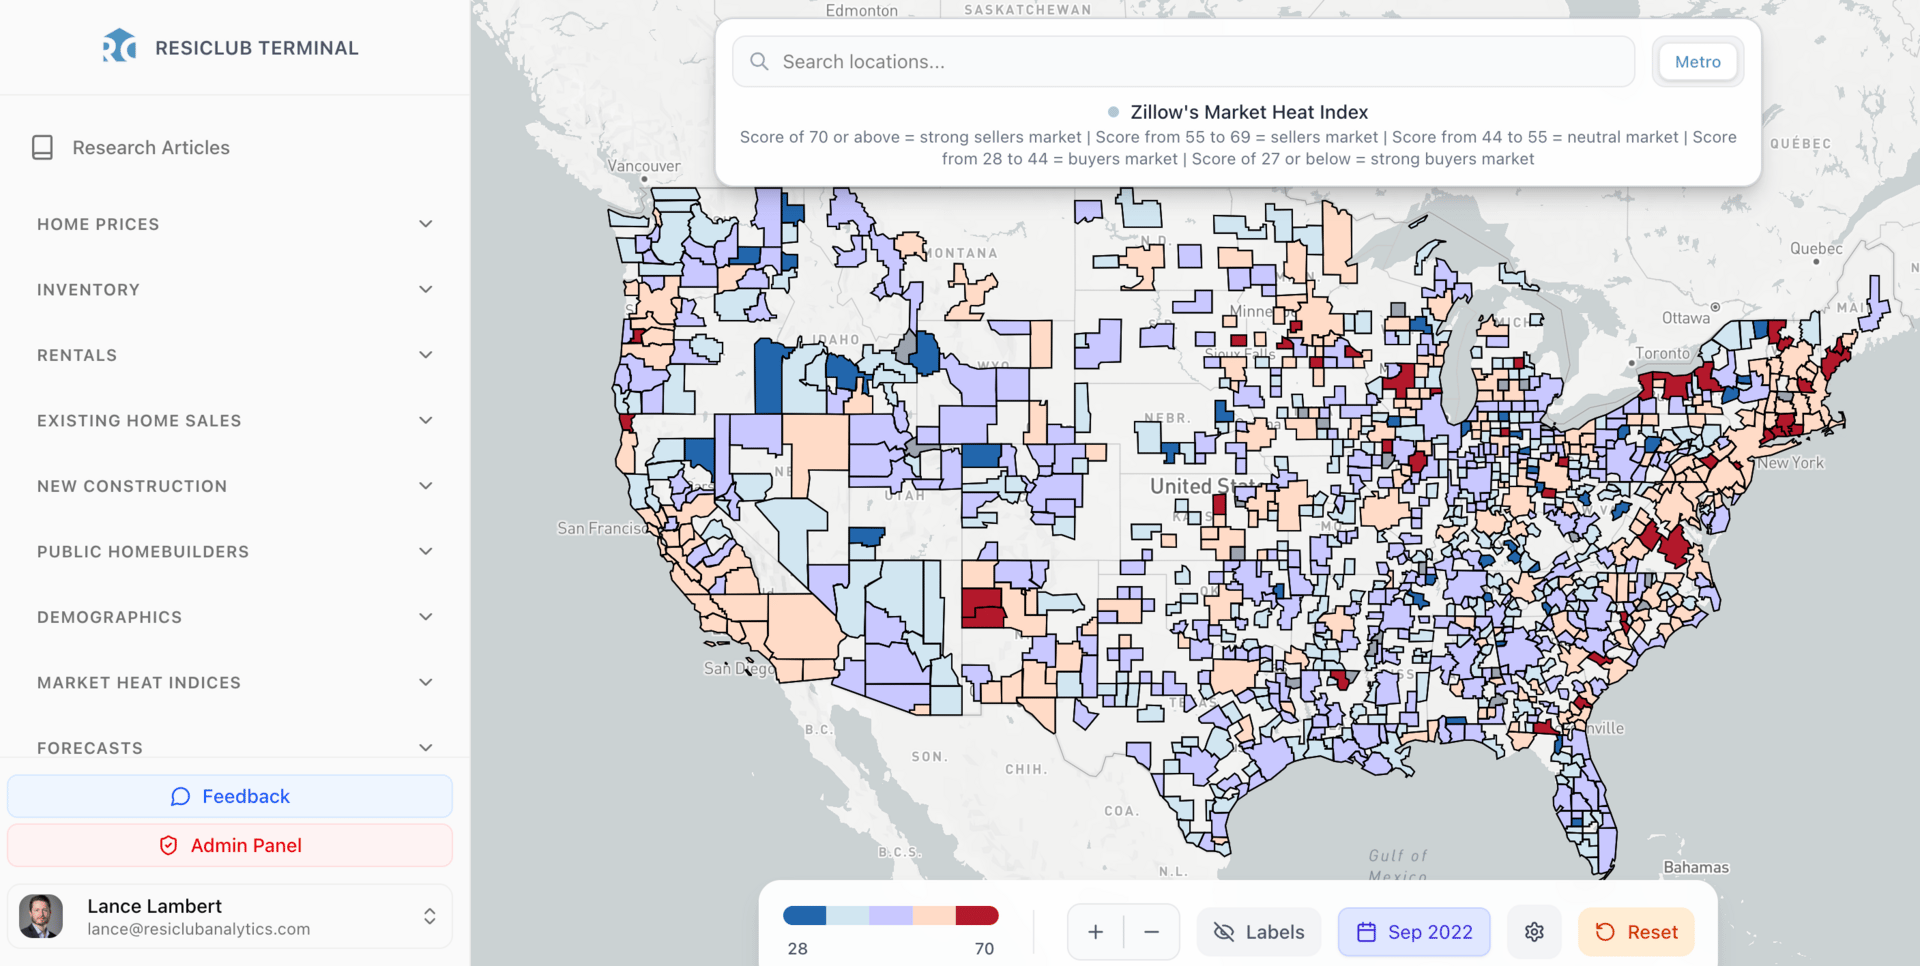
What the index looked like in September 2023 👇
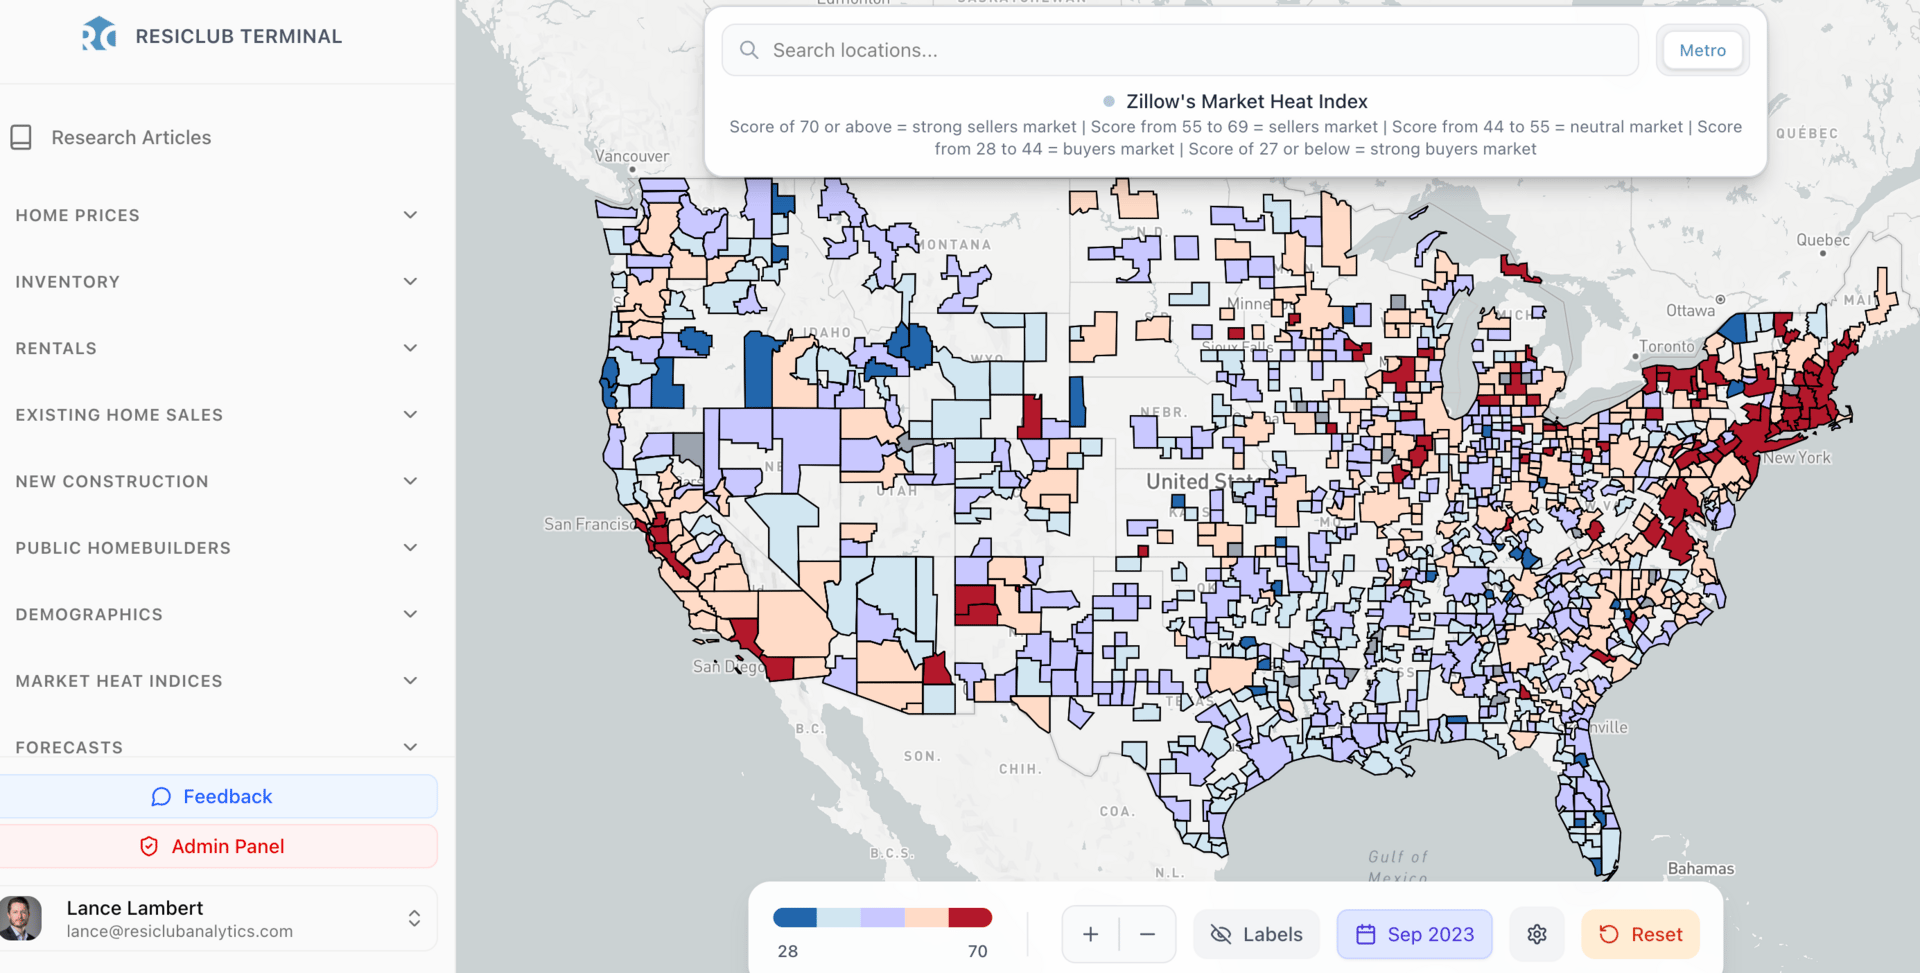
What the index looked like in September 2024 👇
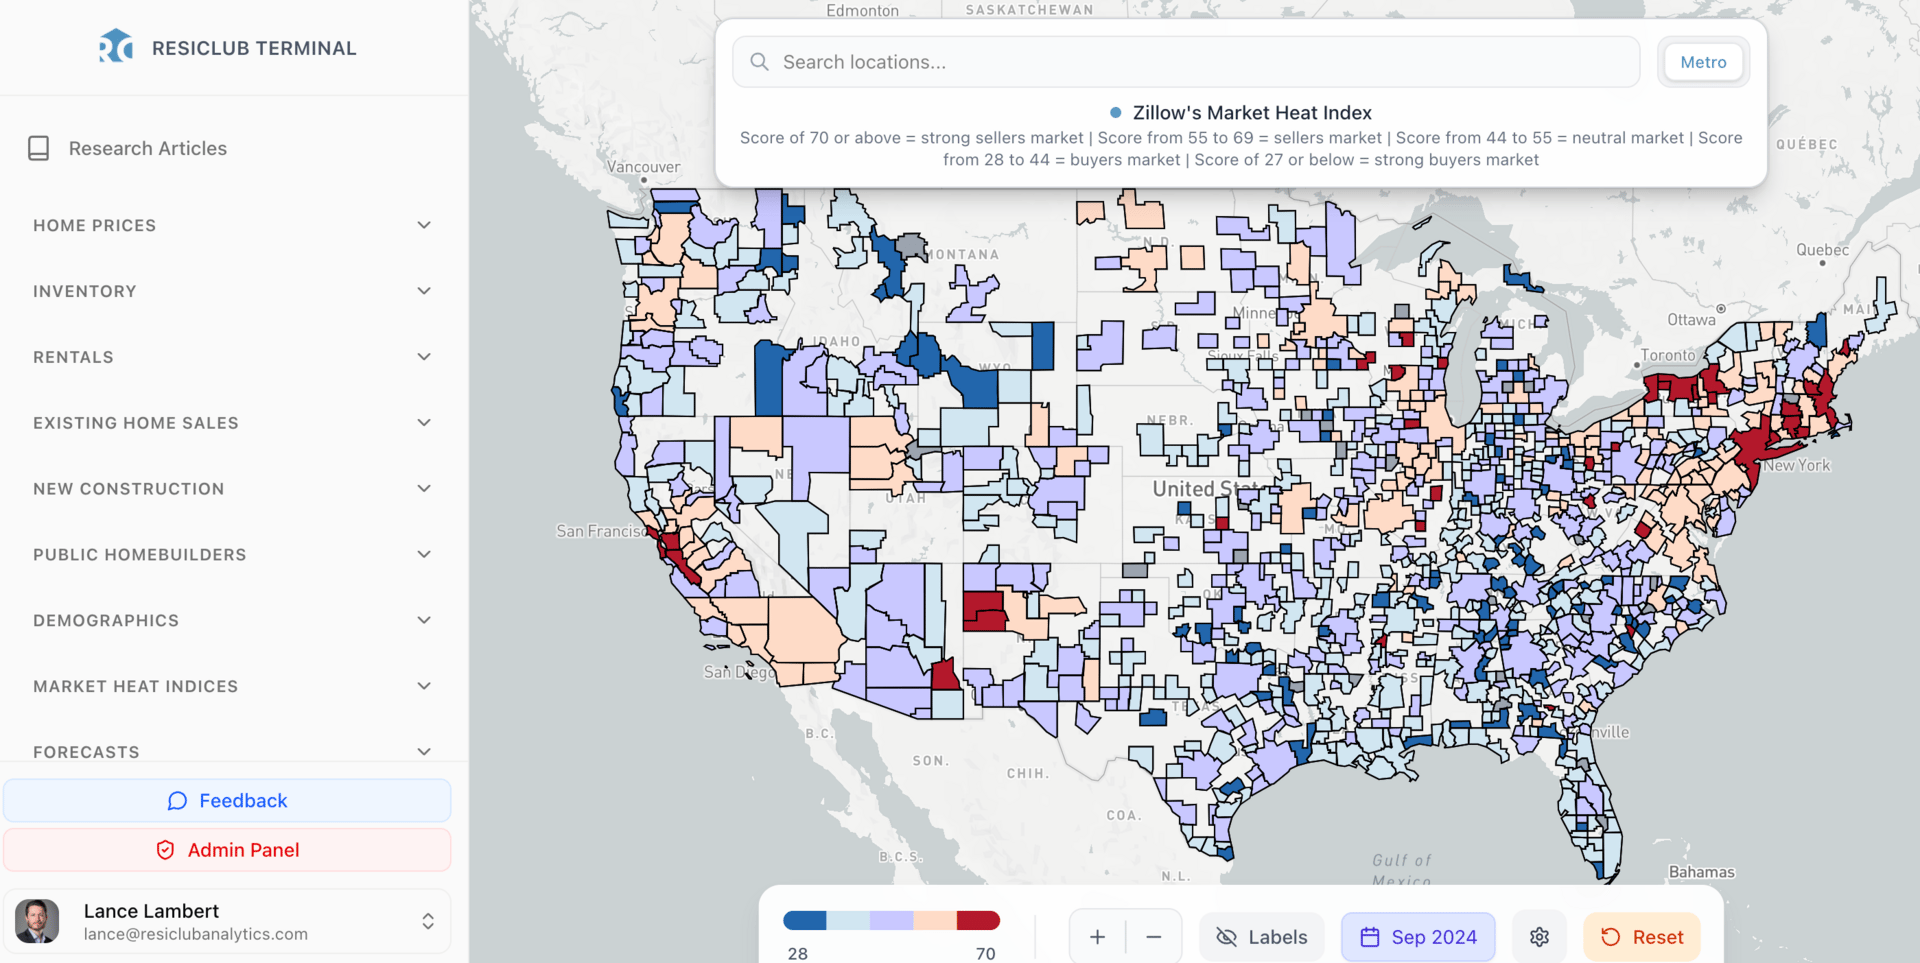
What the index looked like in September 2025 👇
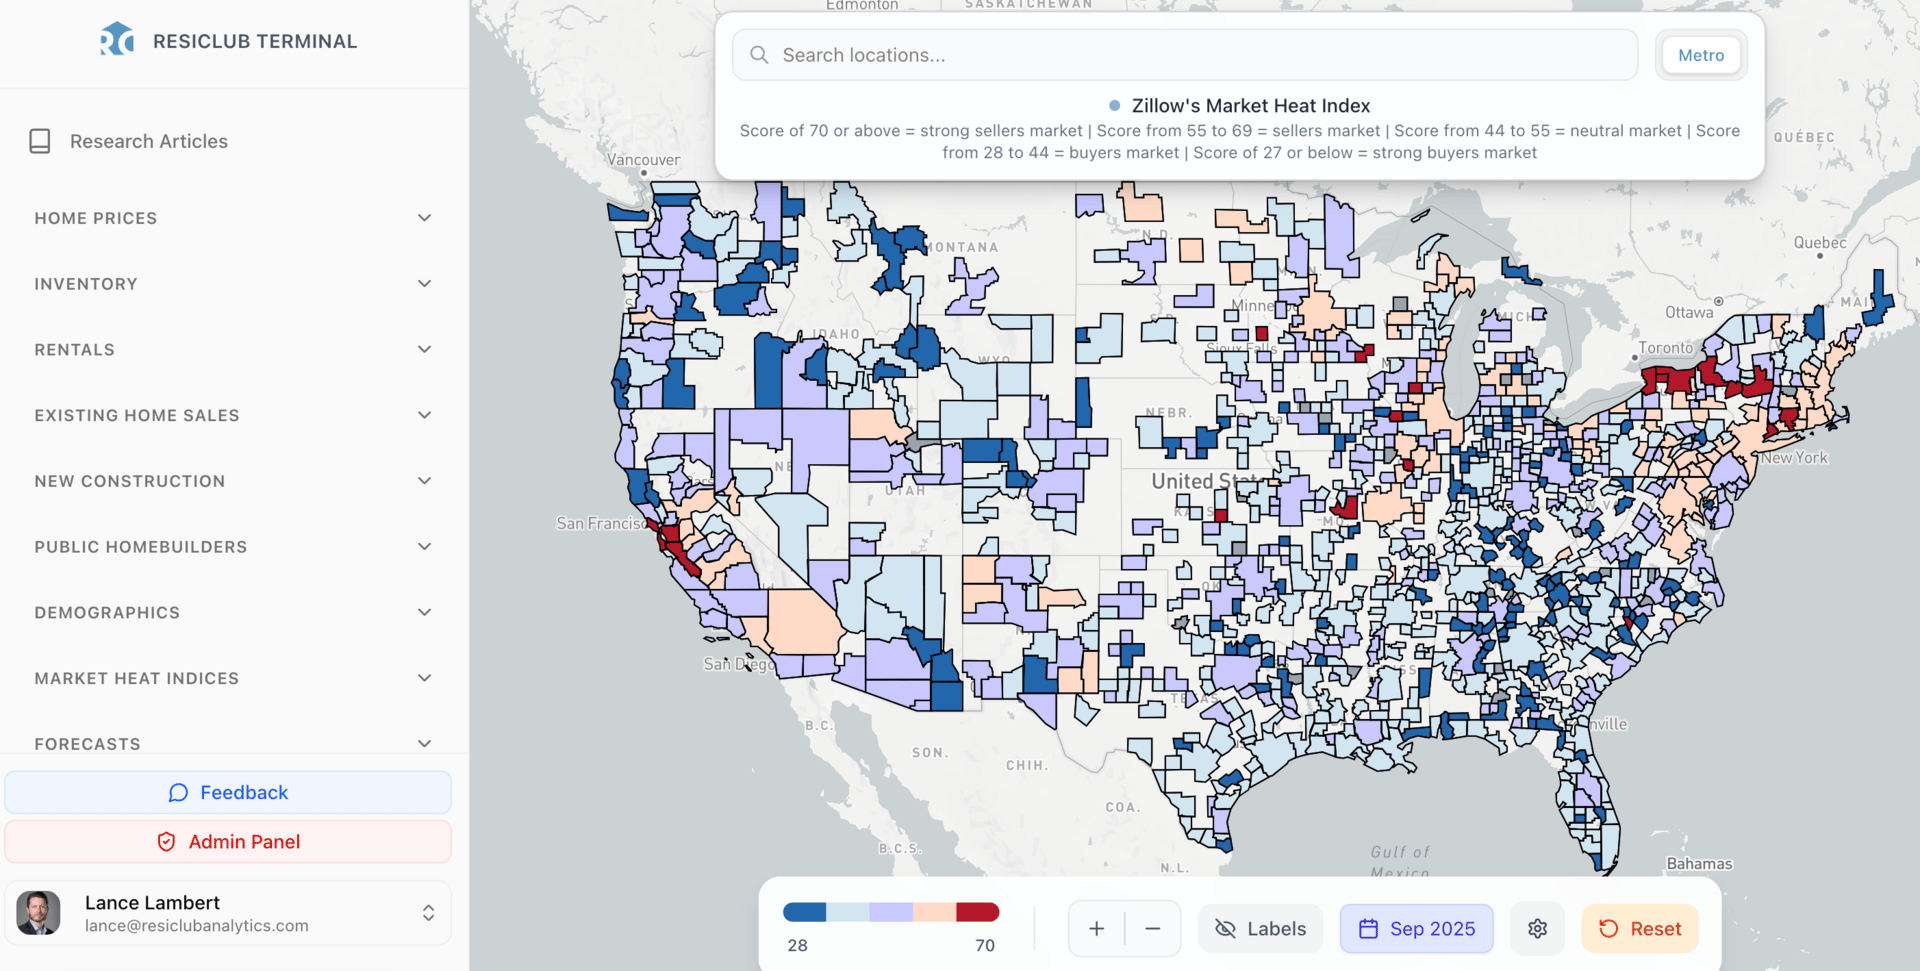
Do I agree with Zillow’s assessment?
Directionally, I believe Zillow has correctly identified many regional housing markets where buyers have gained the most power—particularly around the Gulf—as well as markets where sellers have maintained (relatively speaking) somewhat of a grip, including large portions of the Northeast and Midwest.
Based on my personal housing analysis, I consider Southwest Florida the weakest/softest chunk of the U.S. housing market this year. Not too far behind are pockets of Texas and Colorado—which have also seen a bigger build-up in resale inventory and unsold new-build spec inventory over the past three years.
In my view, many West Coast markets were softer this year than Zillow’s analysis suggests—in particular the areas that have recently seen big jumps in active inventory for sale—while some areas in the Midwest are a little tighter than Zillow suggests.
One more thought: The Zillow Market Heat Index should not be the only metric housing stakeholders look at when assessing market temperature. At a minimum, I’d also recommend looking at the speed of active inventory change, active inventory now versus the same month in 2019, year-over-year home price change, and seasonally adjusted month-over-month home price change. All of those metrics can be found in the ResiClub Terminal down to the ZIP Code level.
