Tomorrow, ResiClub Pro members will get access to the updated Lance Lambert Inventory Tracker, which will provide inventory metrics at the metro and county levels.
There’s no doubt about it, deteriorated housing affordability is a major headwind for the U.S. housing market. That said, the lack of inventory for sale is a tailwind for the U.S. housing market. The lack of existing inventory on the market is the primary reason that spiked mortgage rates haven’t translated into a greater pullback in national house prices.
This morning, Realtor.com published its inventory reading for October. Let’s take a closer look at the data.

In October 2023, there were 737,480 active listings on Realtor.com. That’s -2% below October 2022 (752,314 active listings), however, it’s +30.5% above the height of the Pandemic Housing Boom in October 2021 (565,205 active listings).
But also it still pales in comparison to pre-pandemic levels: Active listings in October 2023 were -39% below October 2019 levels when there were 1,208,001 U.S. homes for sale.

How inventory has shifted between September and October, by year, according to Realtor.com:
October 2017: -21,247
October 2018: +2,773
October 2019: -16,595
October 2020: -15,329
October 2021: -12,361
October 2022: +21,229
October 2023: +35,664
Big picture: The October 2023 jump in active listings clearly indicates that the U.S. housing market experienced more significant cooling than usual last month, undoubtedly influenced by mortgage rates surpassing 8%.

The increase in active listings during October can be attributed to mortgage rates spiking to 8%, which priced out more potential buyers, resulting in homes lingering on the market for longer periods.
How do we know that? Because active listings (i.e. every home for sale) rose despite the fact that new listings (i.e. new homes coming up for sale) fell in October (see chart above).
The lack of “new listings” is one reason inventory hasn’t ticked up even higher. At least that’s what Amherst's CEO Sean Dobson recently told ResiClub.
“During the pandemic what was happening is that new listings volume was pretty healthy, there were plenty of people coming to market for sale, but the velocity at which they were selling was so fast that it was drawing down the inventory. Now it's completely flipped. The pace to draw down inventory on a percentage basis is healthy, but there is just no one selling. The new listings volume has just crashed,” Dobson tells ResiClub.

Why does inventory matter so much?
If inventory begins to rise quickly, in theory, it signals a weakening market. If inventory begins to fall quickly, in theory, it signals a strengthening housing market.
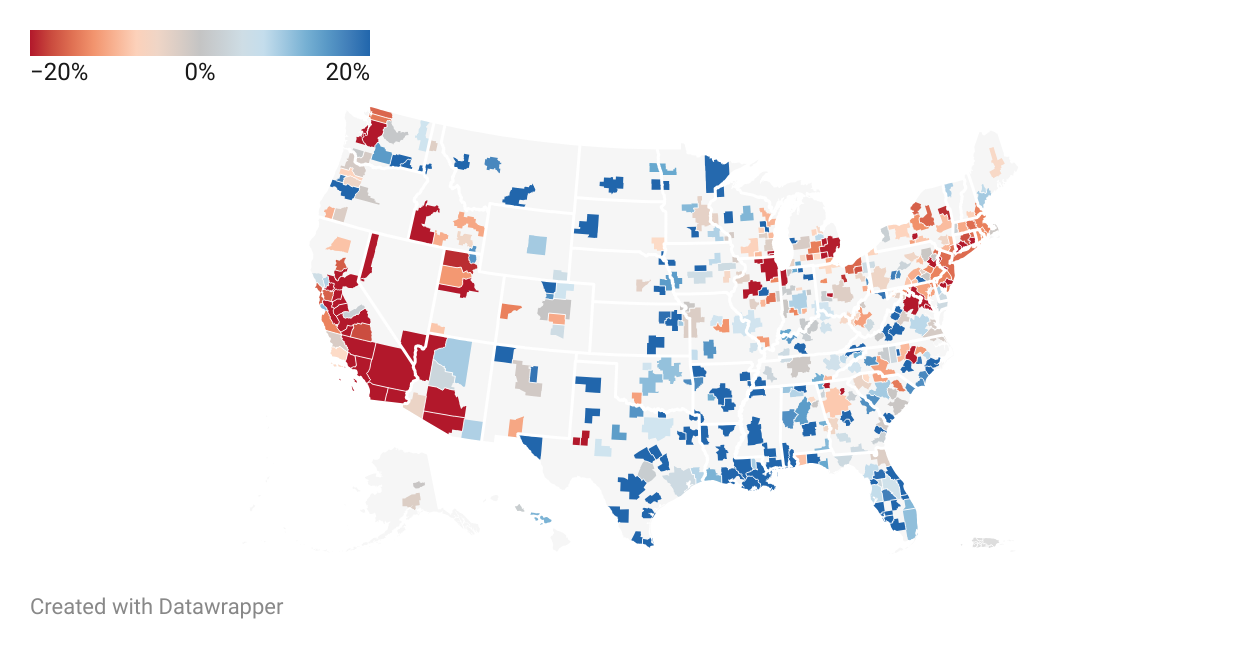
Realtor.com's latest inventory report indicates that several areas in and around Texas and Florida are experiencing a slowdown (see map above).
For months, I’ve been telling readers to not just watch Austin, but to also watch places like Baton Rouge (inventory is up +25.4% year-over-year), San Antonio (+20.6% year-over-year), Memphis (+30.3% year-over-year), and New Orleans (+26.1% year-over-year).

If you click the first map below, you’ll be taken to a link where you can view an interactive map showing year-over-year inventory change between Sept. 2022 and Sept. 2023 in America’s 400 largest regional housing markets.
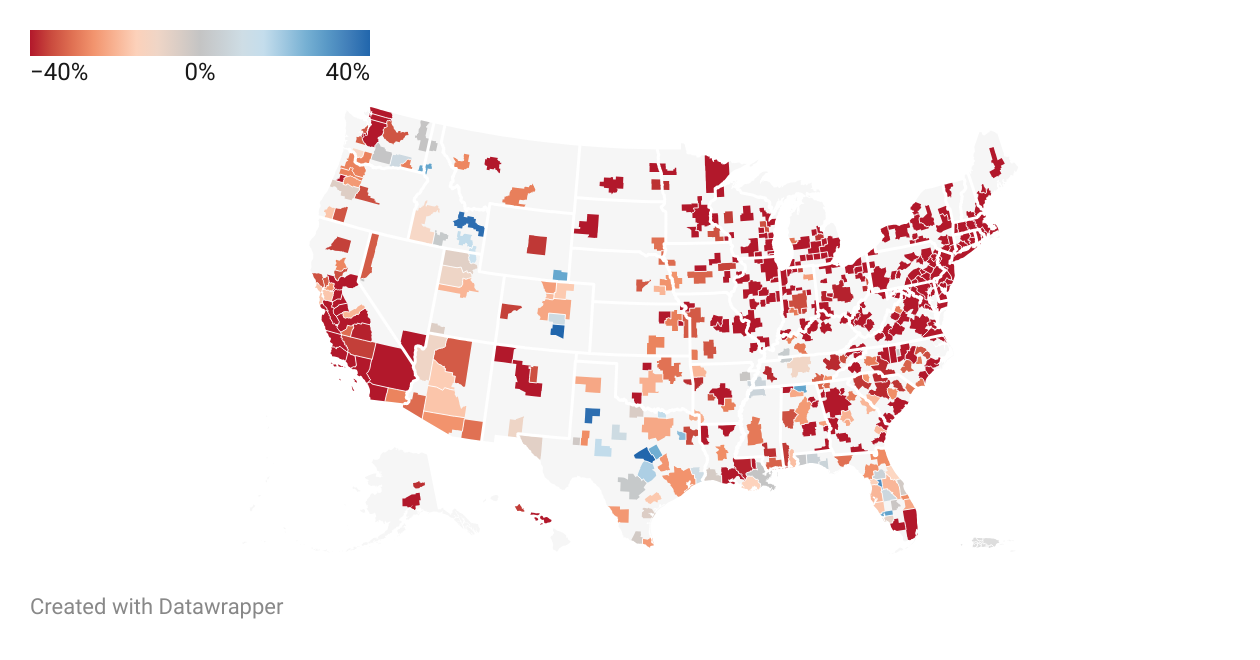
If you click the second map below, you’ll be taken to a link where you can view an interactive map showing the inventory change between Sept. 2019 and Sept. 2023 in America’s 400 largest regional housing markets.
Thank you for subscribing to ResiClub! Nothing in this email is intended to serve as financial advice. Do your own research.