Taking into account mortgage rates, incomes, and house prices, October 2023 stands out as the least affordable month for U.S. housing this century. That’ll happen when mortgage rates spike from 3% to over 7% just after the Pandemic Housing Boom pushed national house prices up 44%.
That fact isn’t surprising to those who’ve followed my work at Fortune Magazine. I’ve spent the past few years chronicling the Pandemic Housing Boom, and subsequent mortgage rate shock.
So what’s the news? I just quit my dream job at Fortune to team up with Anthony Pompliano to co-found ResiClub, a media and research company dedicated to tracking the U.S. housing market. We're in the midst of a historically significant chapter for U.S. housing, and this country desperately needs a data-driven news publication dedicated to covering the nation’s largest asset class.
We’re starting with two data-driven newsletters:
This free daily newsletter, which will feature everything from breaking housing news to one of a kind data visualizations.
ResiClub Pro, which includes all our leading housing market analytics, reporting, and rankings. It'll have 3 additional subscriber-only articles per week; unlocks access to Lance Lambert's regional housing tracker data; features interviews with the biggest players in residential real estate; and subscriber-only residential real estate rankings.
Let’s flip gears, and talk about inventory.
There’s no doubt about it, deteriorated housing affordability is absolutely a major headwind for the U.S. housing market. With that said, the lack of inventory for sale is absolutely a major tailwind for the U.S. housing market. The lack of existing inventory on the market is the primary reason that spiked mortgage rates haven’t translated into a greater pullback in house prices.

According to the latest data published by Realtor.com, there were 701,816 active homes for sale in September 2023. That’s down 4% from the 731,085 homes for sale in September 2022, and a staggering 42.7% below the 1,224,596 listed for sale in September 2019.
What’s going on?
At the onset of the Pandemic Housing Boom, active listings plummeted across the entire nation as an elevated demand for housing (WFH boom + 2% mortgage rates) translated into homes flying off the market at record speed. That last bit is a key to understanding how to read housing data: At times, inventory can fall—and rise—based purely on “days on market” speeding up (i.e. homes selling faster) or slowing down (i.e. homes sitting longer and building up).
And while days on market have ticked higher amid the mortgage rate shock, it hasn’t translated into inventory normalizing back to pre-pandemic levels. One reason being that new listings (i.e. the number of homes coming onto the market in a given month) is down 9.1% year-over-year as many move-up buyers opt to stay put given the elevated mortgage rate environment.

Why does inventory matter so much?
If inventory begins to rise quickly, in theory, it signals a weakening market. If inventory begins to fall quickly, in theory, it signals a strengthening housing market.
Over the past year, the importance of housing inventory as a metric has only been reinforced. In a softened market like Austin—where house prices tracked by Freddie Mac have dropped by around 12% since the 2022 peak—inventory has actually jumped 14.1% above pre-pandemic levels. In contrast, markets like Cincinnati and Philadelphia, with inventory down by 51.5% and 52.6%, respectively, continue to witness record-high home prices. This underscores the critical role of inventory data as a key indicator for understanding and predicting housing market trends. Monitoring inventory levels/speed is essential for individuals looking to buy, sell, or invest.
That’s why in the coming months I’m going to keep a close eye on San Antonio, where inventory has jumped 24.4% year-over-year, and is now just 1.1% below pre-pandemic levels.

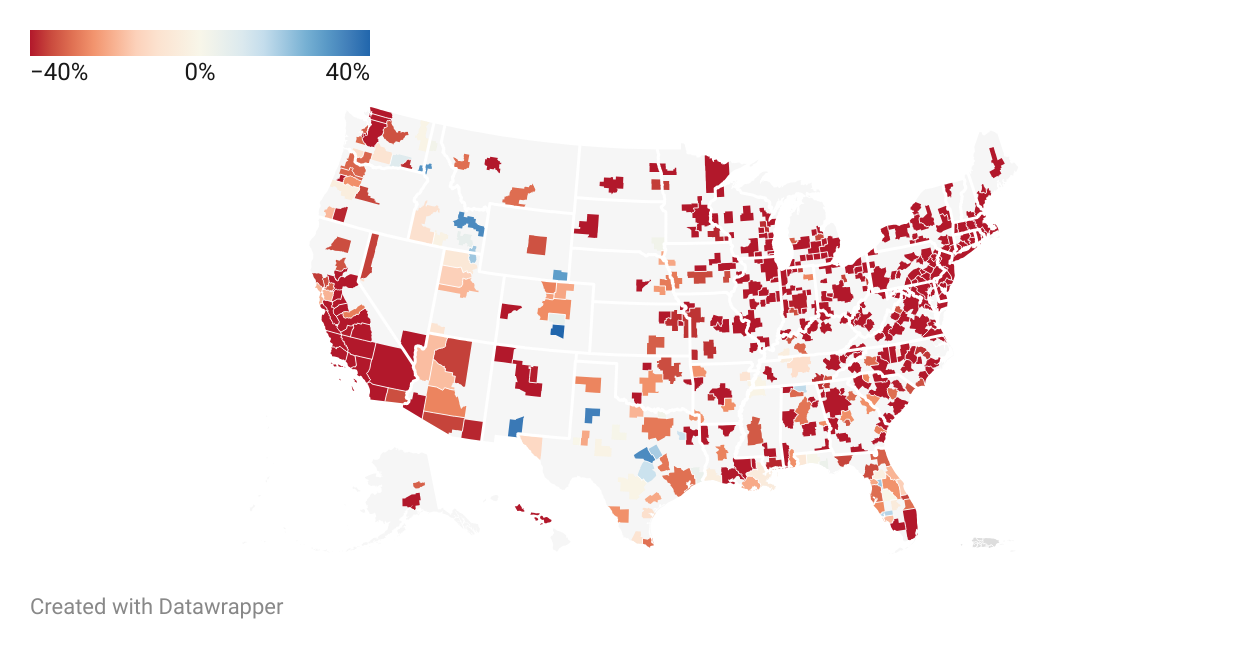
If you click the image below, you’ll be taken to a link where you can view an interactive map showing the inventory change between Sept. 2019 and Sept. 2023 in America’s 400 largest regional housing markets.
Again, thank you for subscribing to ResiClub!
Tomorrow, subscribers who have upgraded to ResiClub Pro will get full access to the “Lance Lambert inventory tracker.” The spreadsheet includes inventory data for nearly 800 regional housing markets.